Lab2: AC signals, capacitors, inductors, and frequency dependence of filters
The goal of this lab is to get familiar with AC signals, build circuits with capacitors and inductors, and measure their behavior in both the time domain and the frequency domain.
Outline: Prelab assignment, Capacitor circuits in the time domain, Capacitor circuits in the frequency domina, Resonant circuits with inductors
Prelab assignment
Read chapter 2 of the textbook.Read about the sweep feature of your function generator (BK 4007B) in its user manual. Google around to find a good tutorial about frequency sweeps and using an oscilloscope to measure the frequency response. Add a link to at least one in your prelab ELog entry.
Capacitor circuits in the time domain
Measure the time domain response of an RC circuit set up as an integrator.
Set up the integrator circuit shown below.
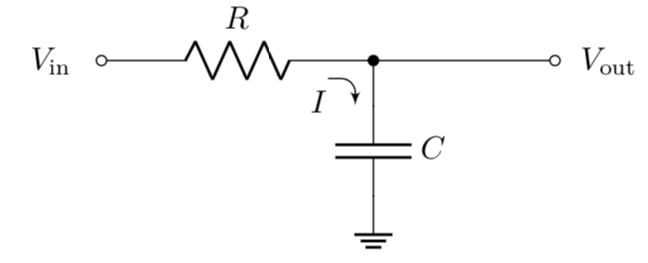
Choose any capacitor and resistor values you prefer, although very small or very large resistance values could be harder to measure. Something between 1k and 50k is reasonable.
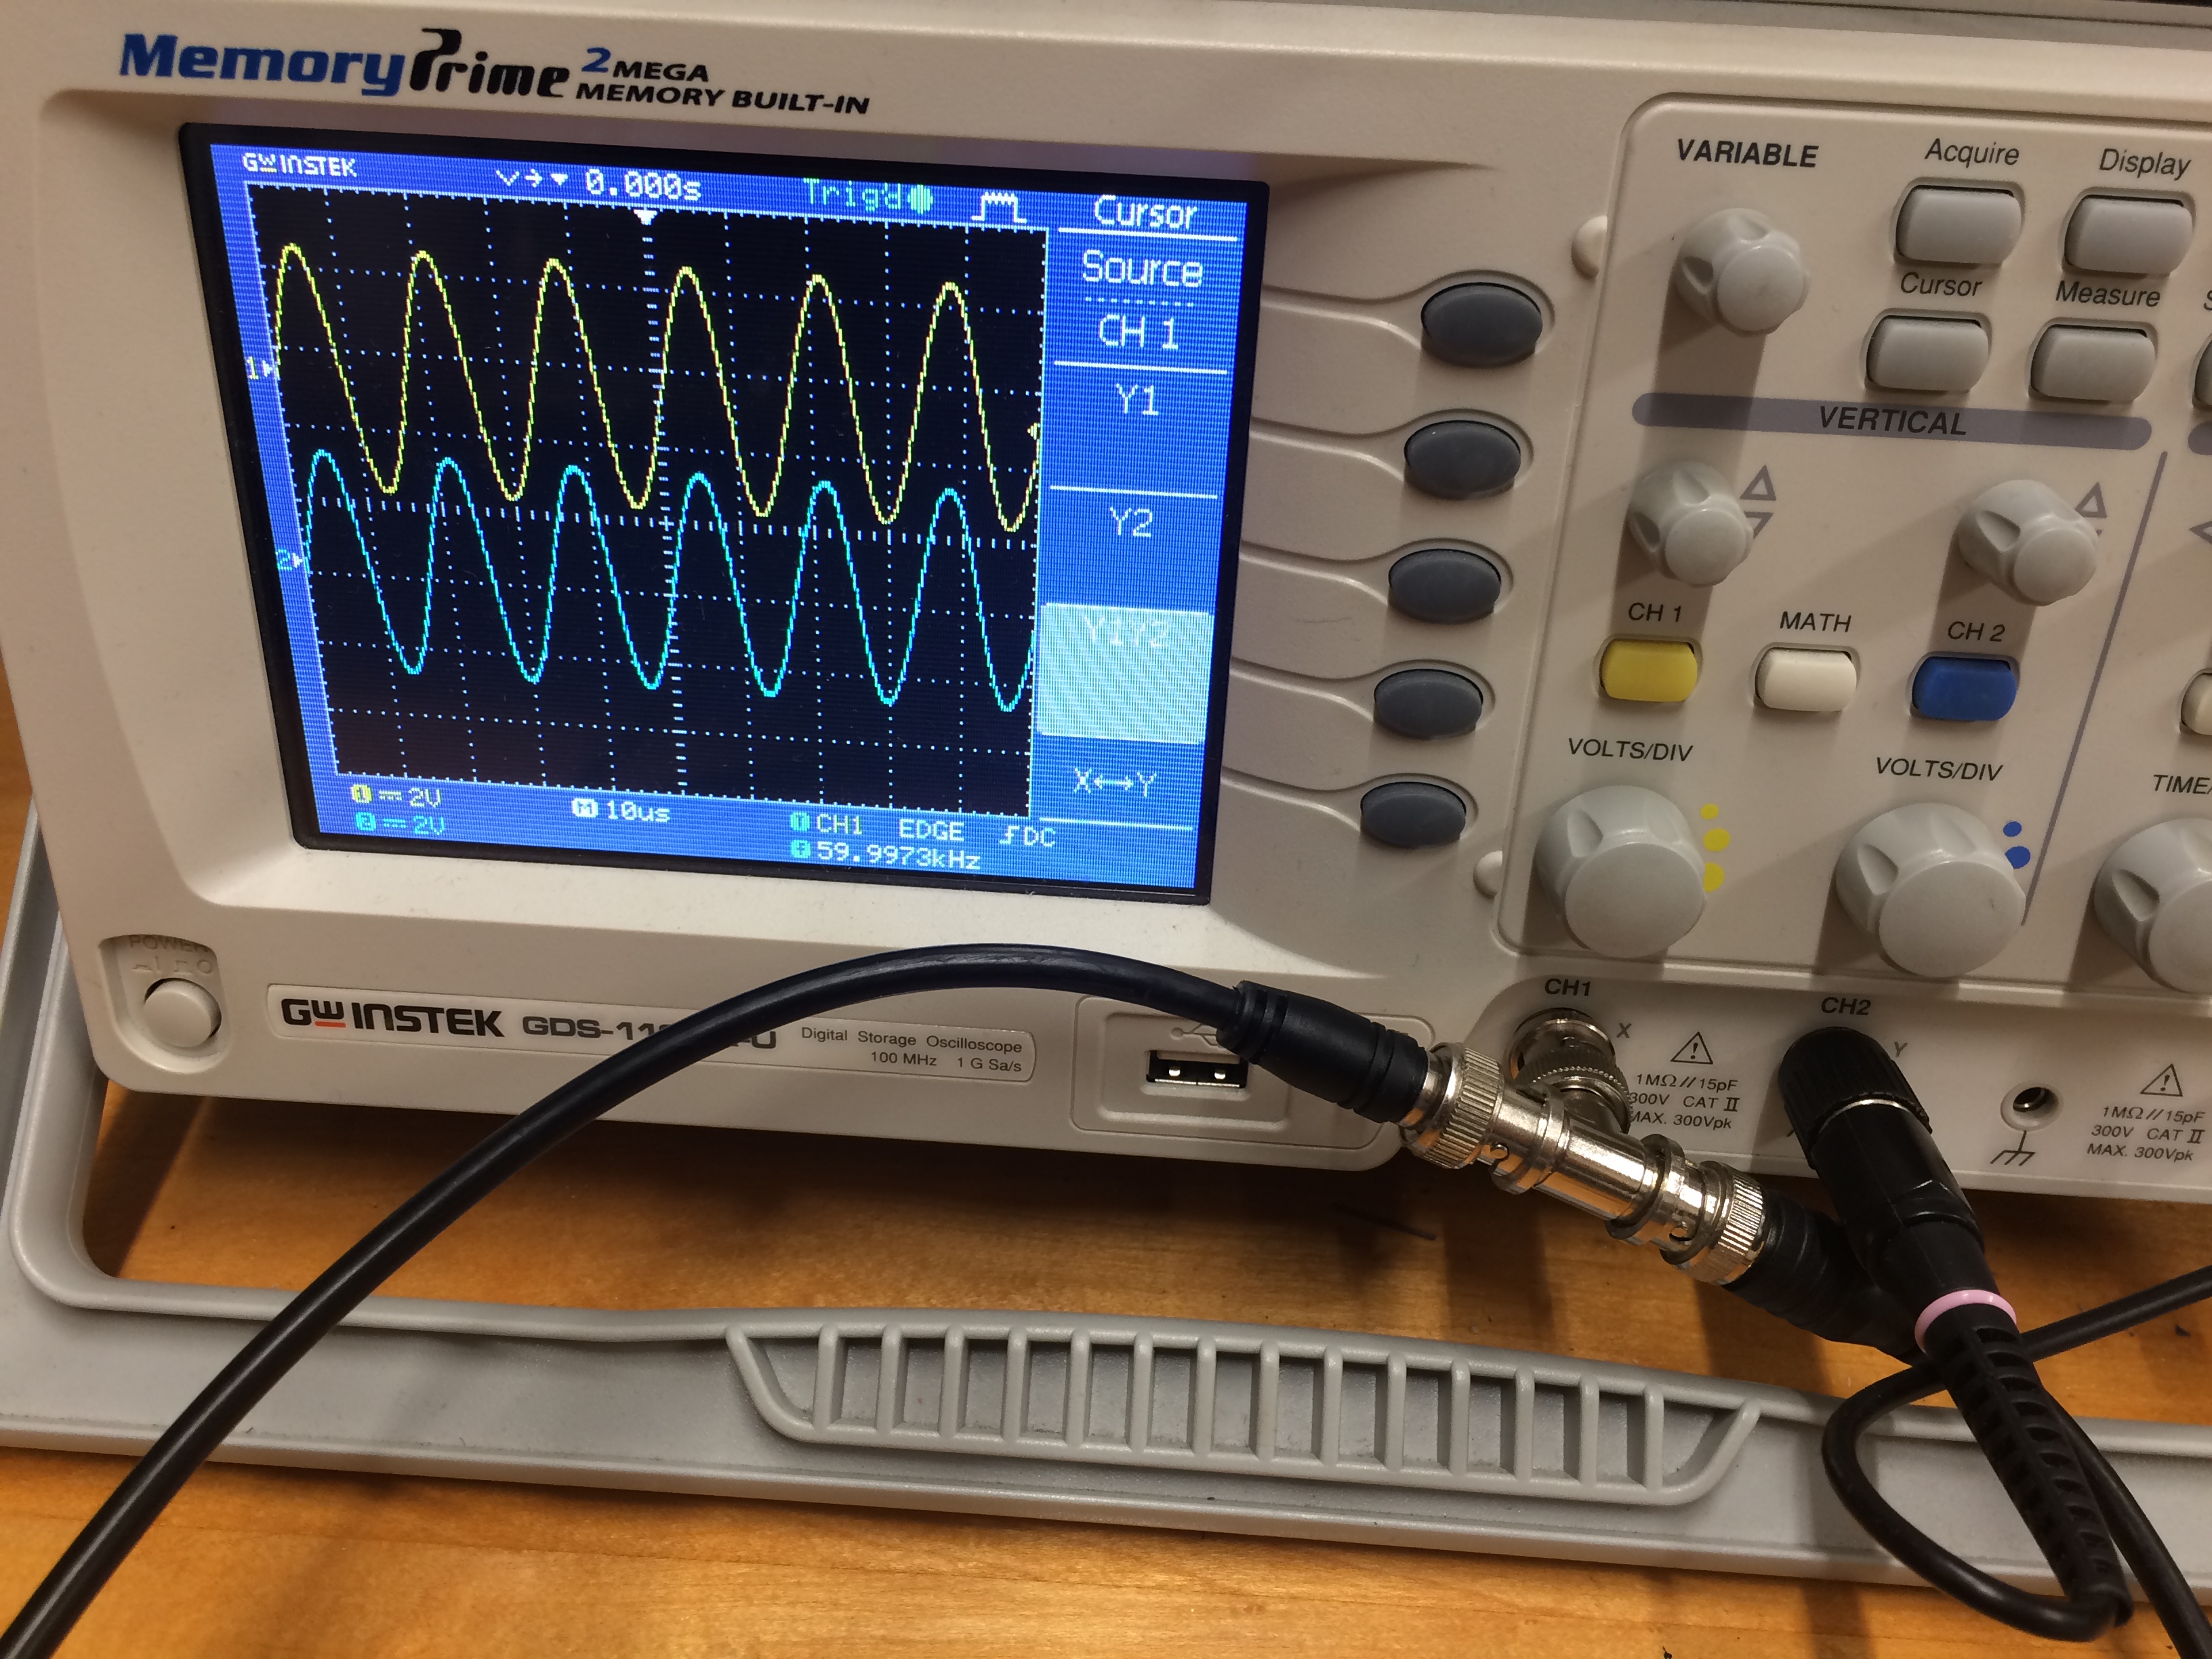
Feed a square wave into the input and measure the output on the oscilloscope.
Use the waveform to determine the value of RC. You will need to vary the frequency of the square wave and the settings on the scope until you get a waveform that makes this easy to measure. You can use your ohmmeter to measure the value of R and hence determine the capacitance, C.
For the measurement above, it is cumbersome to use grabbers to both bring the signal in and measure it on the scope. So you can just use a BNC tee to connect the input signal to the scope directly, which will spy on the signal as it passes by, without need for two sets of grabbers. See for example, here.
If you could not easily use an ohmeter to measure R, e.g., because it was buried inside a closed circuit stage, you could still measure its resistance with an appropriately designed measurement circuit. Suppose for example, that you put another resistor, R2 with a known value, across Vout and remeasured the integrator response. The maximum value that the output can reach is no longer Vin. Instead, the two resistors (R and R2) make a voltage divider that sets the maximum output voltage. Using the measured value of R2, deduce the value of the first resistor, R.
Build a new integrator circuit where you replace R with a 1 MΩ resistor. You should no longer use the second resistor, R2, in this circuit. Measure the output of this circuit with grabbers connecting to the scope. You will note that the maximum of the output only reaches half of the input. Why? (Hint: think about the input impedance of the scope.)
Measure the time domain response of an RC circuit set up as a differentiator.
Set up the differentiator circuit shown below.

Choose any capacitor and resistor values you prefer, again avoid very large or very small resistance values. (The ones you initially used in the previous step would be fine).
Feed different function generator signal types into the input and measure the output on the oscilloscope for each of these. Specifically, you should measure the output for inputs of a square wave, a triangle wave, and a sinewave. Save scopecaps of each, showing both the input and the output waveforms, and explain their behavior in terms of what you expect from the differentiator property of the circuit.
Briefly explain the behavior that you see for each signal type. Note that the output is not always a proper derivative of the input because we had to make an assumption in obtaining the Vout = RC dVin/dt relation. And indeed, the derivative of the sinewave may not match your expectation. In that case, just record what you see and note that the discrepancy.
A capacitor has infinite impedance for DC signals, so it can also be used to block the DC component of a signal. Test that by feeding a sine wave into the input of your differentiator and give it a DC offset of a few hundred mV. You should see that the DC offset is removed from the output. We use the term "decoupling" for this, where the capacitor decouples the DC offset level of the output from the DC level of the input. (Beware in doing this measurement that the oscilloscope has its own AC or DC input selection option. Figure out how to set that and make sure the scope is in DC coupling so it will show and DC offsets.)
Capacitor circuits in the frequency domain
Your differentiator circuit can also be viewed as a "filter", which attenuates signals with a frequency dependent scale factor. The differentiator circuit you built is the same as the high-pass filter described in Example Problem 2.37 of the textbook.
Feed sine waves with a number of different frequencies into your differentiator circuit and measure how the amplitude of the output varies with frequency. It should follow the expected response function, with a -3dB point matching what you calculate given the circuit's RC value, which you measured previously.
To make the full frequency response graph, you would have to vary the frequency of the input in small steps, measure the ratio of the input and output signals' magnitudes at each frequency step, and then plot the ratio of |Vout|/|Vin| as a function of frequency. Doing that by hand would be tiresome and inefficient. But you can set the original to some simple amplitude, like 1 V, and then watch the amplitude reduce as you change the frequency. You could make measurements as a function of frequency and plot it, if you are well motivated, or you could just find the frequency that corresponds to the -3dB point.
Next, do a similar measurement of the frequency response of the integrator (low-pass filter) you built at the beginning of the lab. Confirm that the -3dB point is where you expect.
A nice way to get the frequency generator and scope to do all the work for you is to use the frequency generator's sweep function to vary the input frequency over a ms timescale. Then you can zoom out the scope's timescale to the ms scale to see the response change as a function of time as the generator "sweeps" the frequency over time. Try that. You don't need to extract a quantitative form from it, but do it to learn, and save a scopecap. Beware, however, that the sweep feature has a limited frequency range.
Resonant circuit
Using an inductor to build an LCR circuit as the one shown below.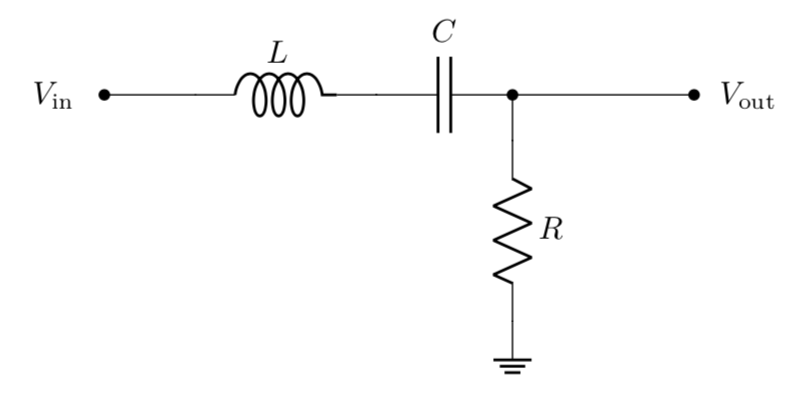
Measure its frequency response and determine the key resonant frequency.
Change the resistance value and see how it affects the response.
Modify the circuit so that instead of having a high response at the resonant frequency it has a very low response at that frequency, i.e., make it a notch filter that passes all frequencies expect those in a narrow range. Measure its response function.
Going above and beyond
If you send a square wave from the function generator into CH1, via a BNC tee, and then into CH2 with a second coaxial cable, you might notice that there is a small delay between the rise of the pulse in CH1 and CH2. That is due to the speed of the pulse moving down the cable between CH1 and CH2. Measure that delay and the length of the cable to determine the speed. It will be less than c by an amount that corresponds to something akin to the "index of refraction" of the cable.